Reports & schedule grading
Two tools live on the org Stats page for turning your team-comparison data into something you can hand to someone else: a graded, printable schedule report, and a frozen public link to the charts themselves.
Who can do this
Section titled “Who can do this”Site admins, organization admins, and league admins (scoped to their own league’s data).
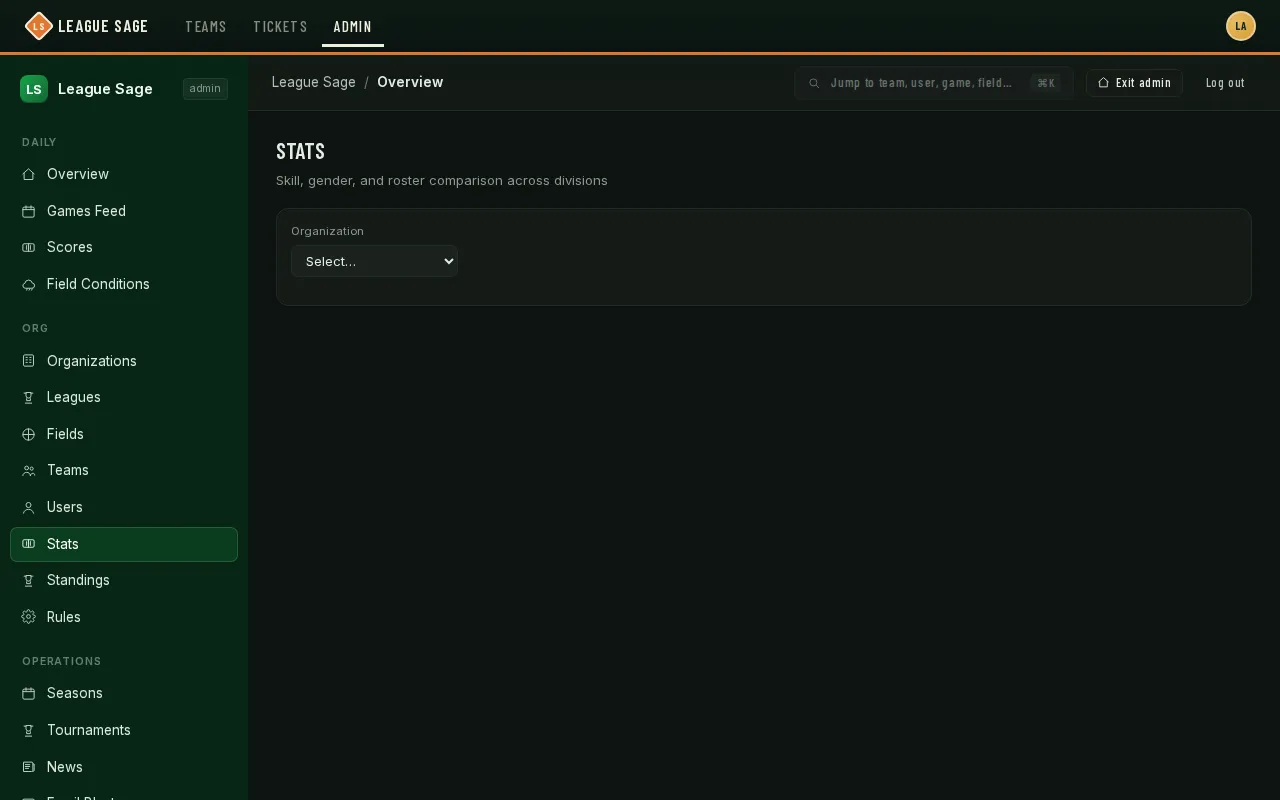
- Open Organization → Insights in the admin sidebar and pick a Sport and a Division, then click Generate — this loads the skill, gender, age, and roster comparison charts for that division, and mounts the two report tools below.
- For a graded schedule: find the Schedule Report card and upload a Date/Home/Away spreadsheet (CSV or TSV — a plain export from wherever you built the schedule). Click Analyze.
- The report grades every matchup: a skill-gap severity band between the two teams’ skill index, any pair meeting more than once flagged with which meeting number this is, and — if you’ve run Suggest Divisions recently — a cross-division flag when the pairing crosses a division line. It also catches scheduling slip-ups: teams idle on a date they’re supposed to play, and teams accidentally double-booked the same date.
- Click Open report ↗ to hand the analysis to a print-friendly page: a front summary (team rankings and the ten most problematic games) followed by one page per week, ready to save as a PDF.
- To share the comparison charts themselves — not the schedule report — use Share snapshot after generating: it freezes exactly what’s on screen (charts, shared-players data, and any staged division suggestion) behind a read-only public link, no login required.
Good to know
Section titled “Good to know”- The schedule report never touches the database — parsing and grading both run in your browser off the file you uploaded, so nothing about your schedule is stored anywhere by uploading it.
- A team name that matches two different teams in the same sport (say, the same nickname in two divisions) can’t be safely guessed — it’s excluded from grading and listed on the report so you can fix the name and re-run it.
- The printable report only opens correctly from the Open report ↗ button itself; pasting that URL into a new tab on its own won’t carry the data over.
- A shared snapshot link expires after 90 days and each organization can have at most 20 active at once — the oldest is dropped automatically once you’re at the cap. There’s no manual revoke, but an expired link simply stops working.
- Re-running Suggest Divisions after you’ve already analyzed a schedule doesn’t retroactively recolor the report — the card will prompt you to re-analyze so the two stay in sync.